Service Designer in digital governance: how we designed a prioritization model for the IDB

As Service Designer & UX Lead at Continuum, I led for 7 months the design of the first digital governance model for the IDB's operational cycle: a +150-page Playbook with a common language, defined roles, an objective prioritization formula and a 6-stage process — co-created with 26 stakeholders from 9 areas and validated before the leadership of Operations, IT and Change Management. The most honest impact indicator: implementation was conditioned on hiring the profiles we defined.
Banco Interamericano de Desarrollo (BID)
Service Designer & UX Lead
2023 (7 meses)
Remoto para BID USA
Scroll

AGILE GOVERNANCE MODEL FOR OPERATIONS

UJM del modelo y sus partes

A black box that was affecting management and trust

The IDB was in the middle of a digital transformation with the goal of becoming a results-oriented bank. The technology team (ITE) received requests for digital system improvements from multiple vice-presidencies without any standardized process: some came through the formal Convergence system, others by email, others in hallway meetings. There were no clear categories, no prioritization criteria, and no visibility into the status of ongoing requests.

The result: widespread frustration, parallel channels that bypassed the process, and a perception that technology decisions were opaque and arbitrary.

When the process is bureaucratic, bypassing it is the logic

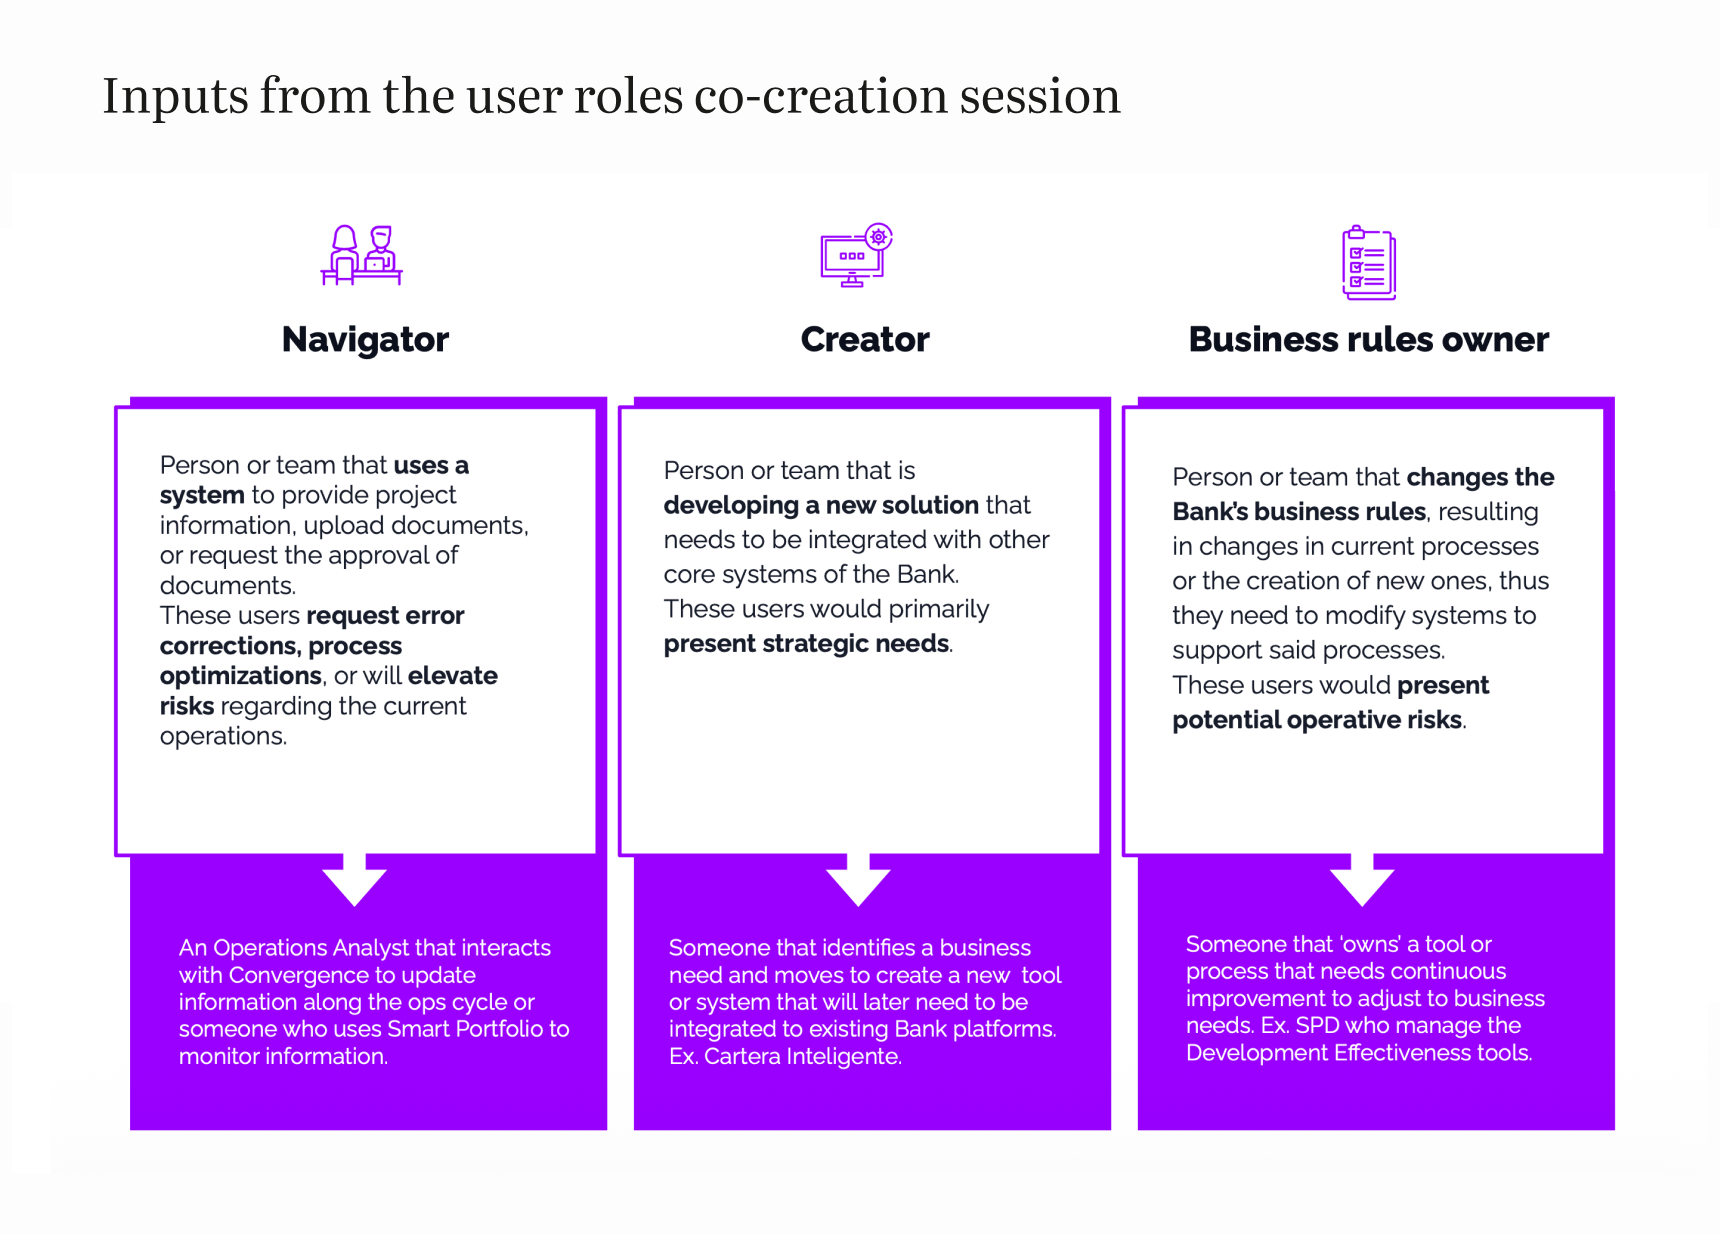
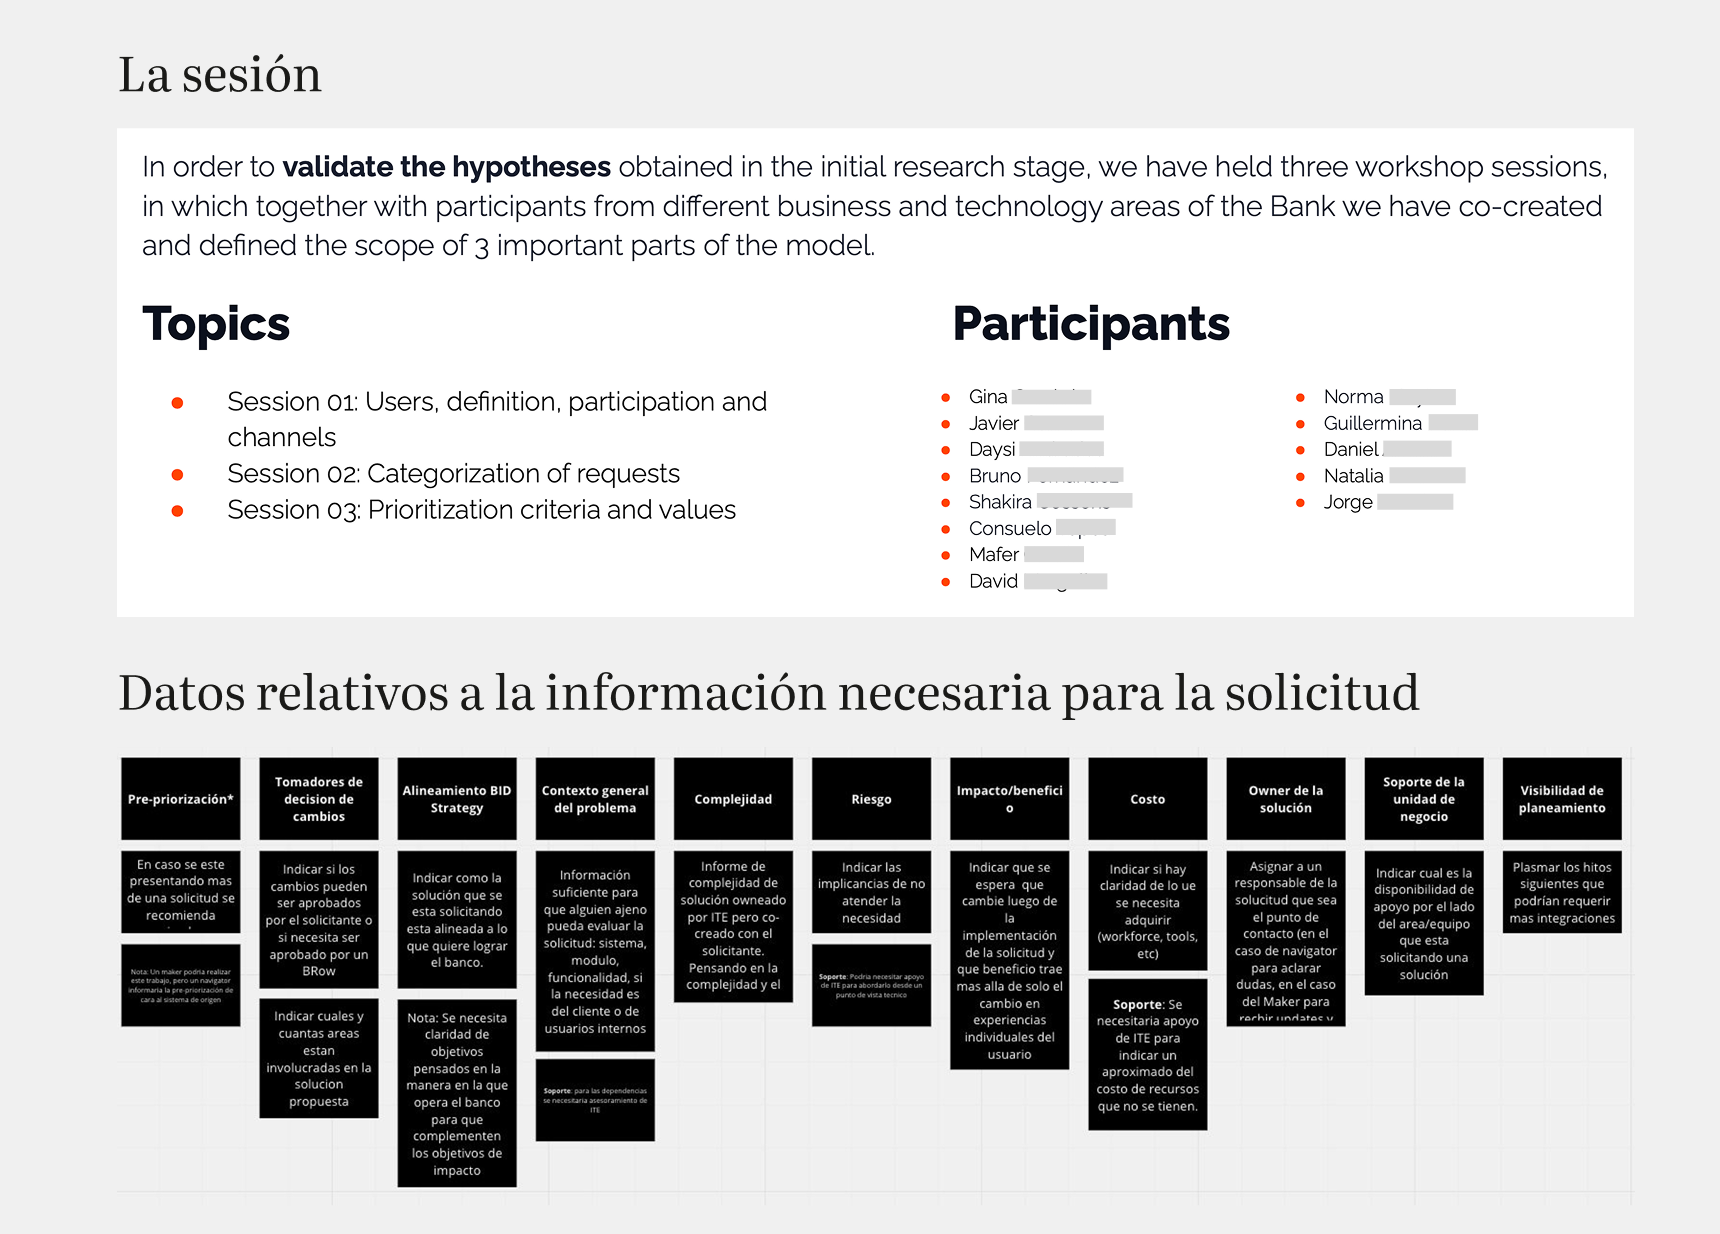
Condujimos 26 entrevistas en profundidad con miembros del banco en roles que iban desde analistas operacionales hasta especialistas IT senior, distribuidos en áreas como VPC, ORP, VPFI, TE, SPD y ADS.

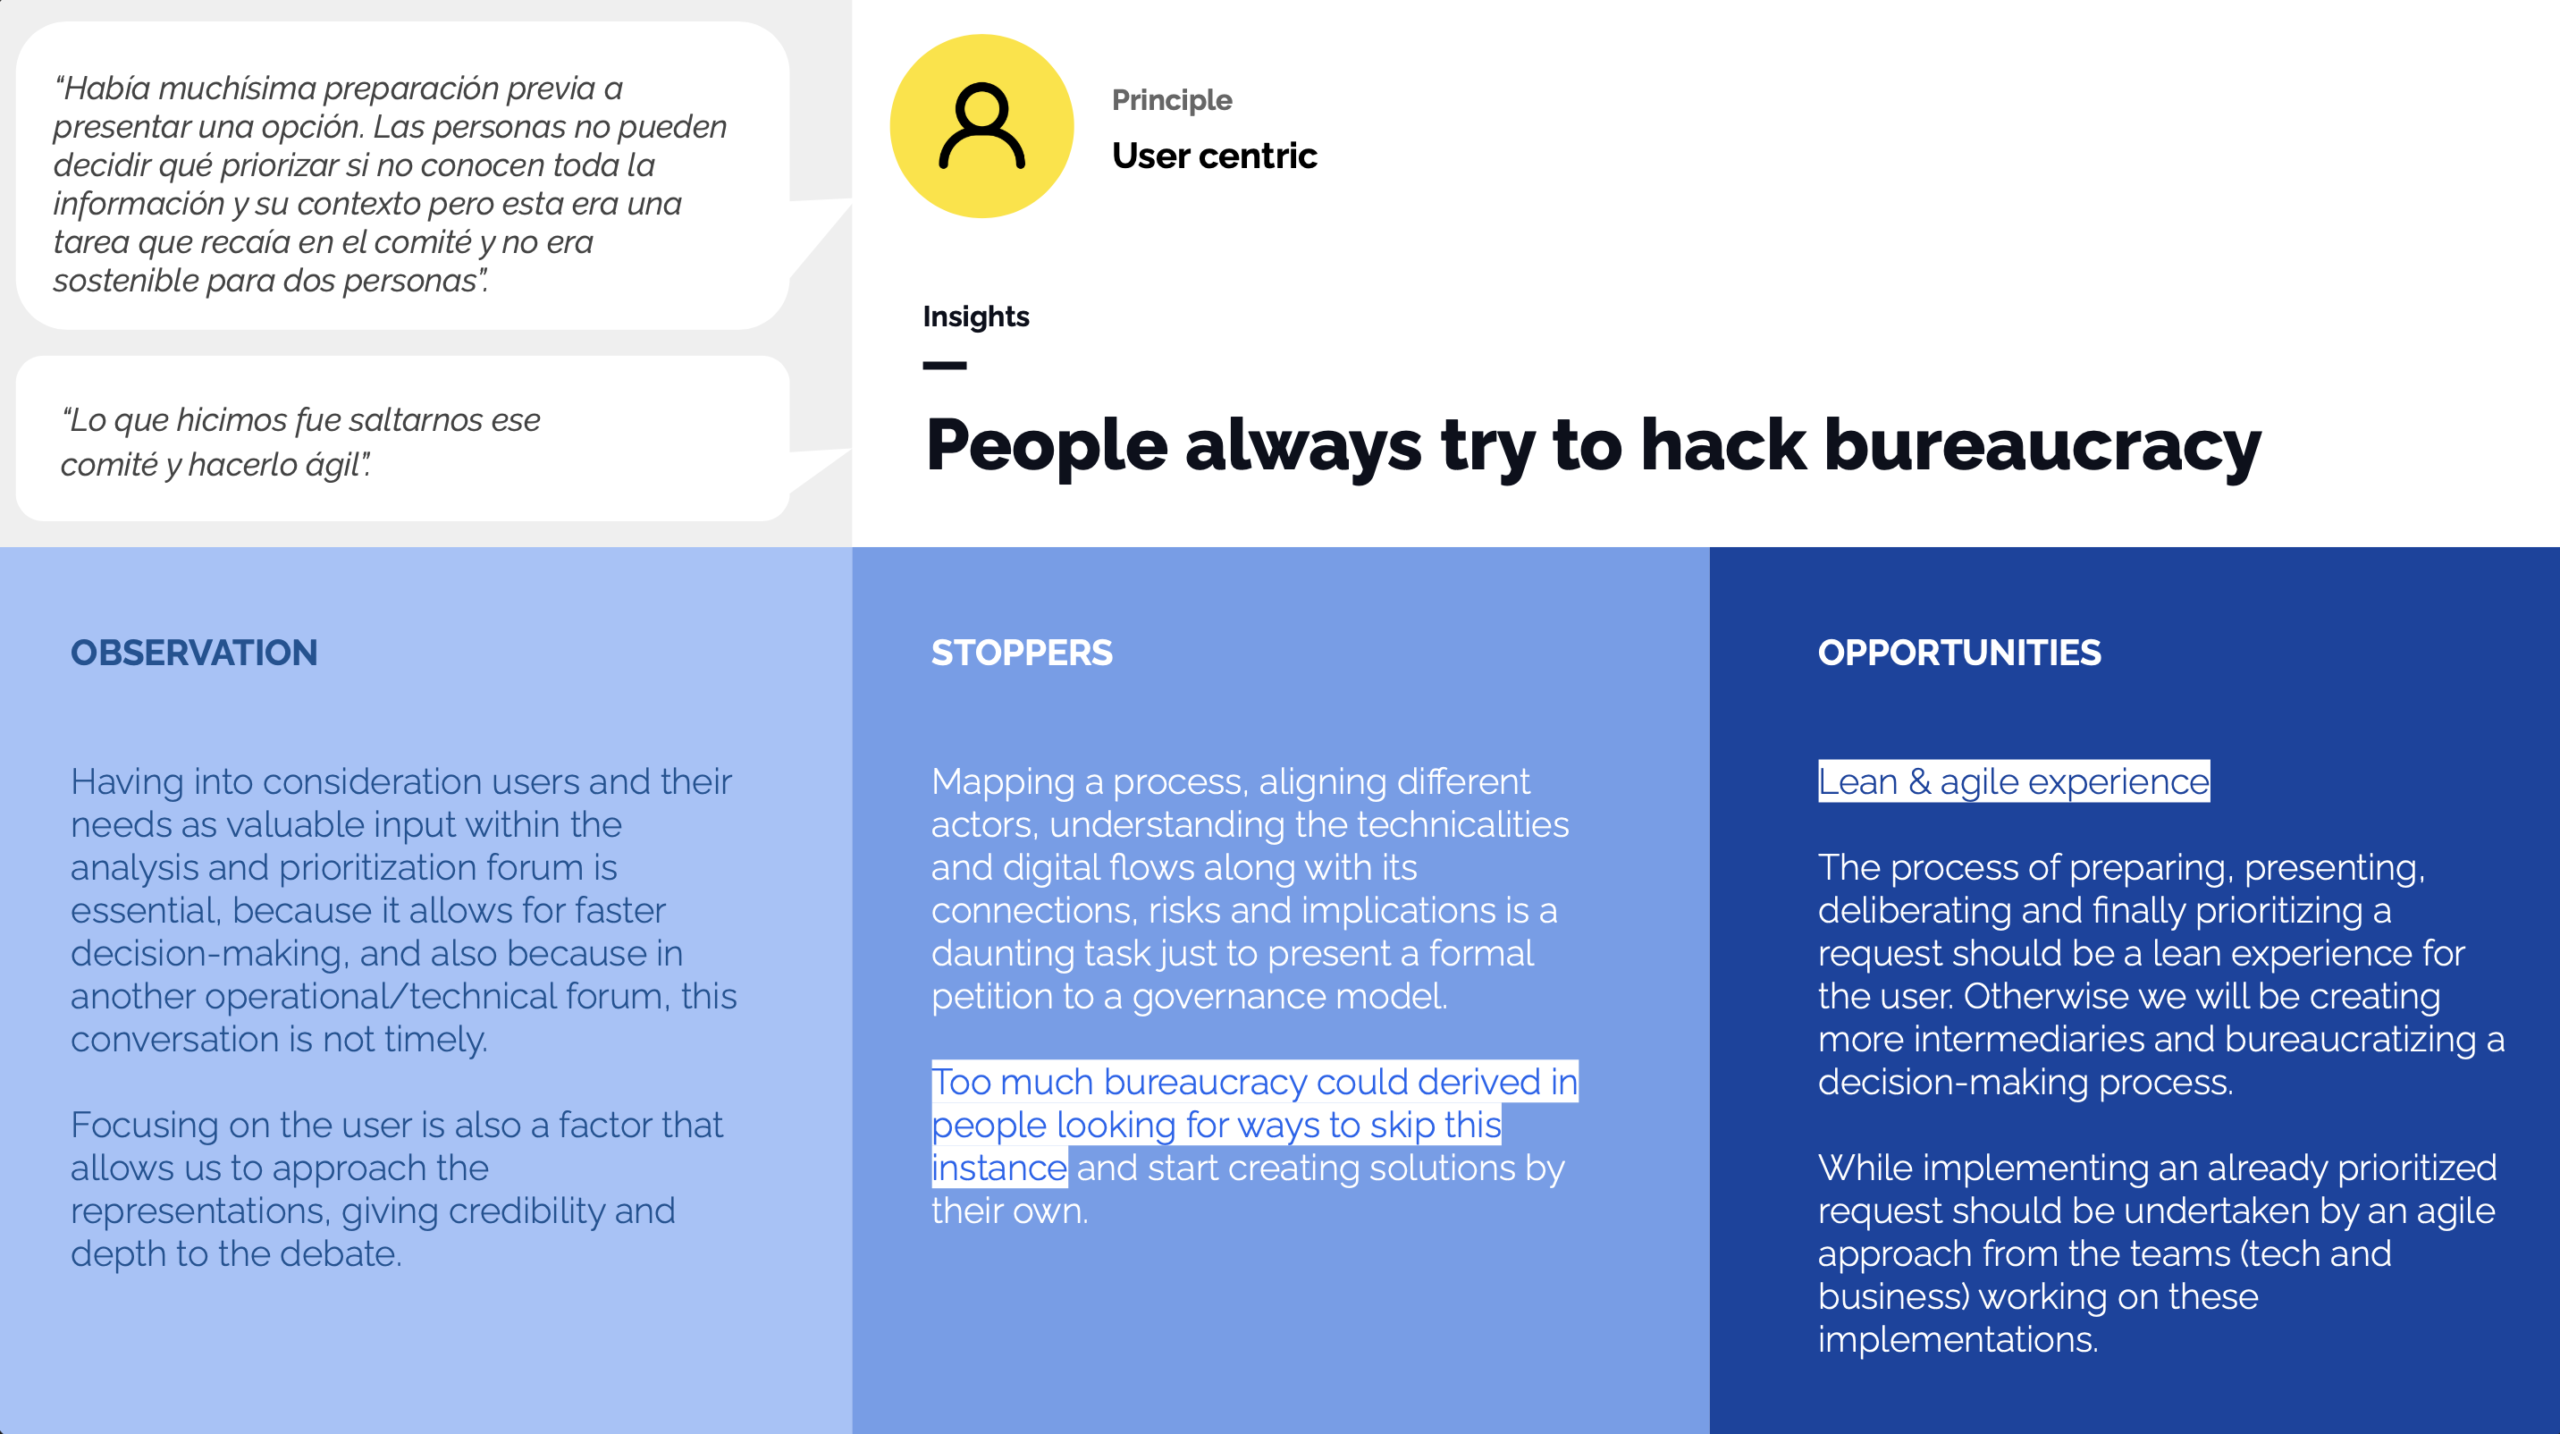
El objetivo de las entrevistas era entender cómo llegaban actualmente las solicitudes tecnológicas a ITE, qué criterios se usaban para priorizarlas, qué fricción experimentaban los solicitantes y qué workarounds habían desarrollado los equipos para sortear el proceso formal.

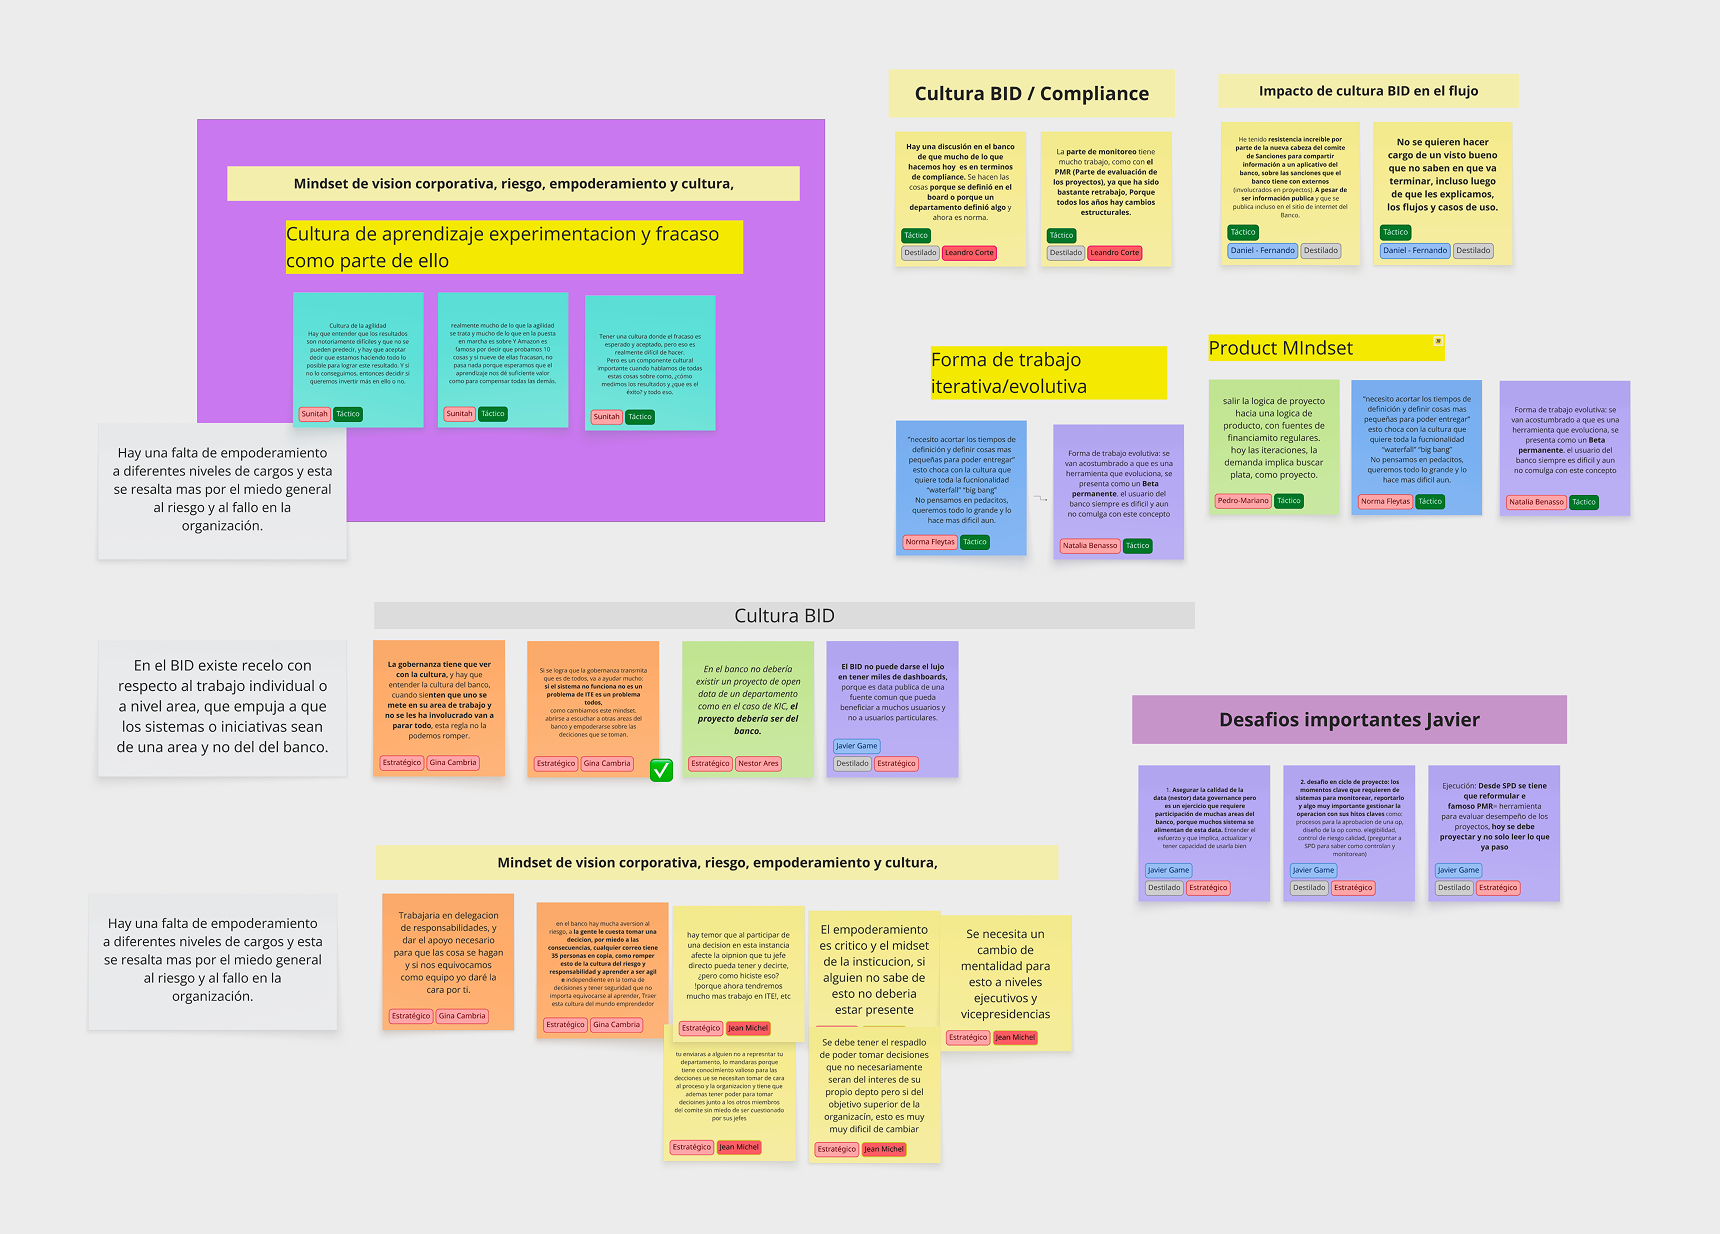
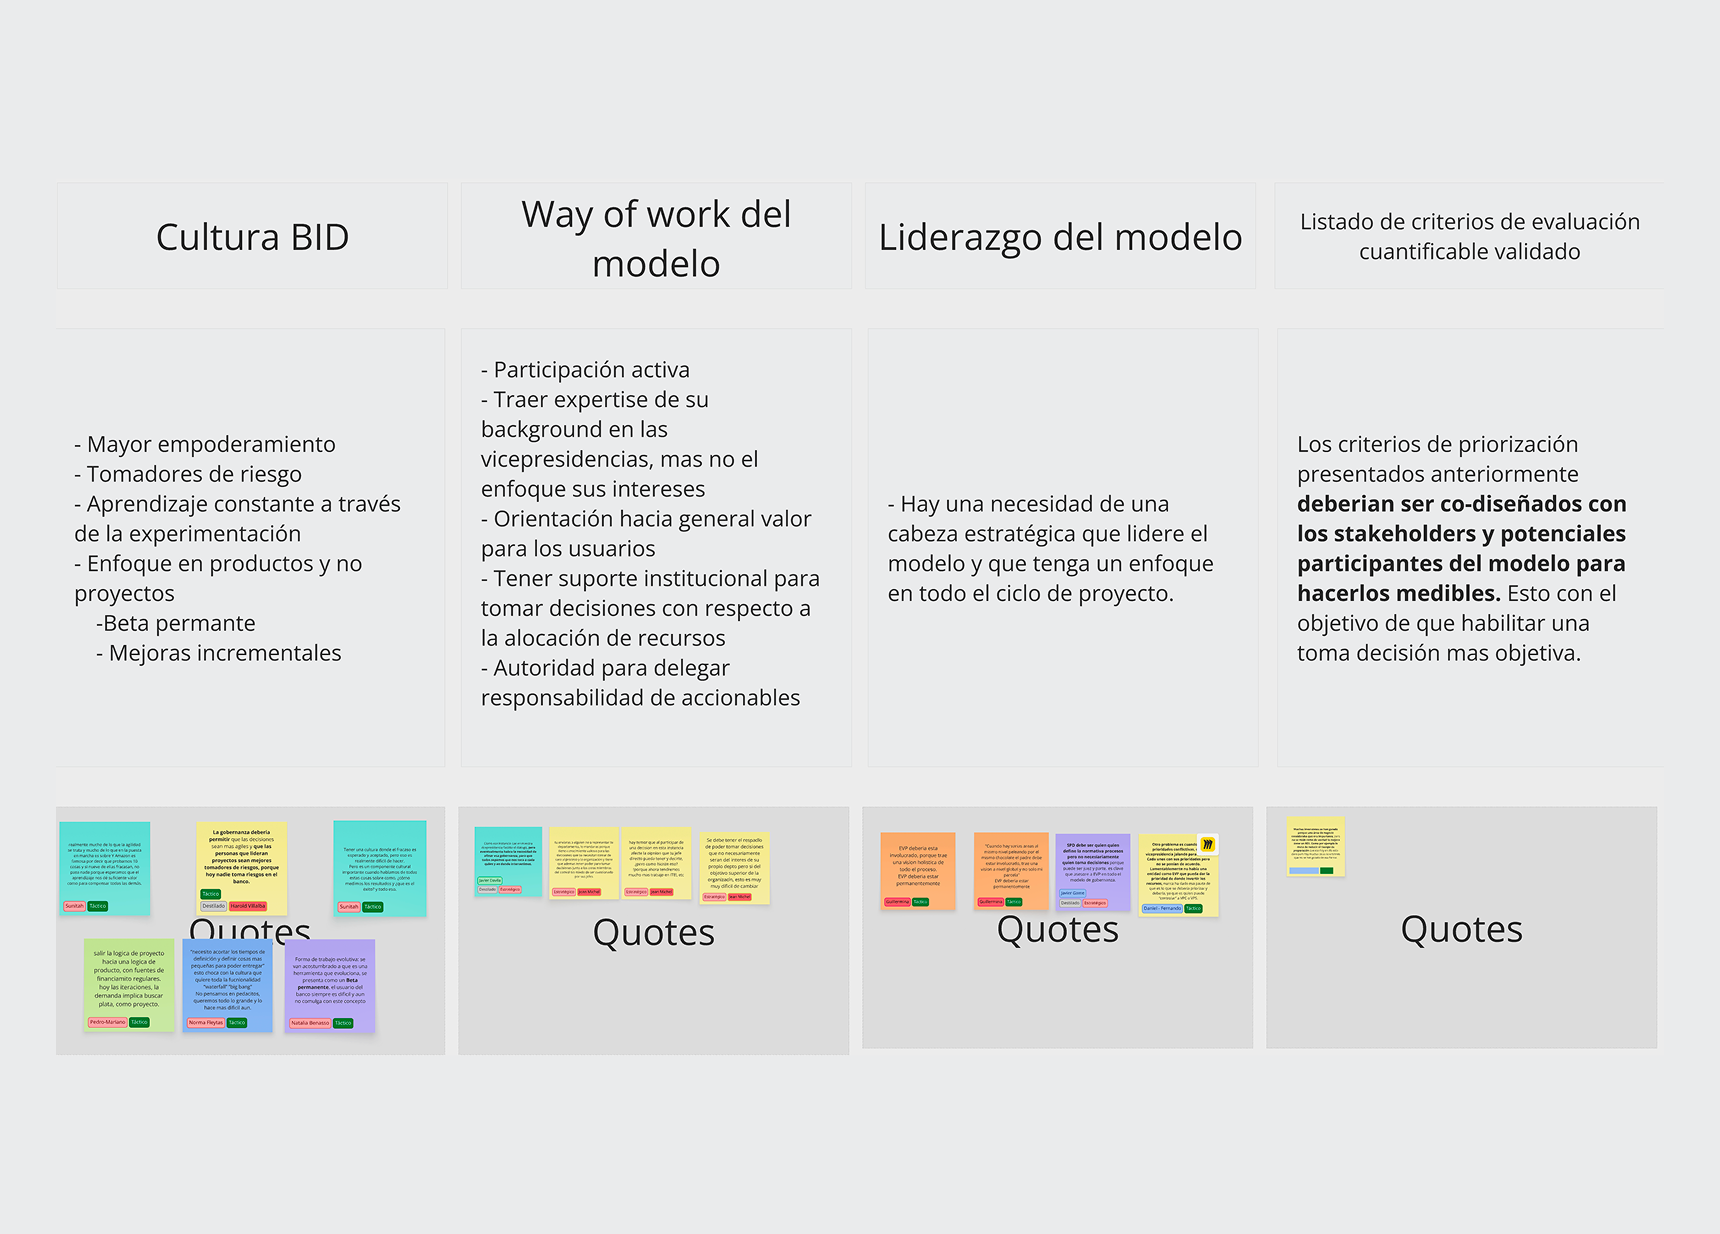
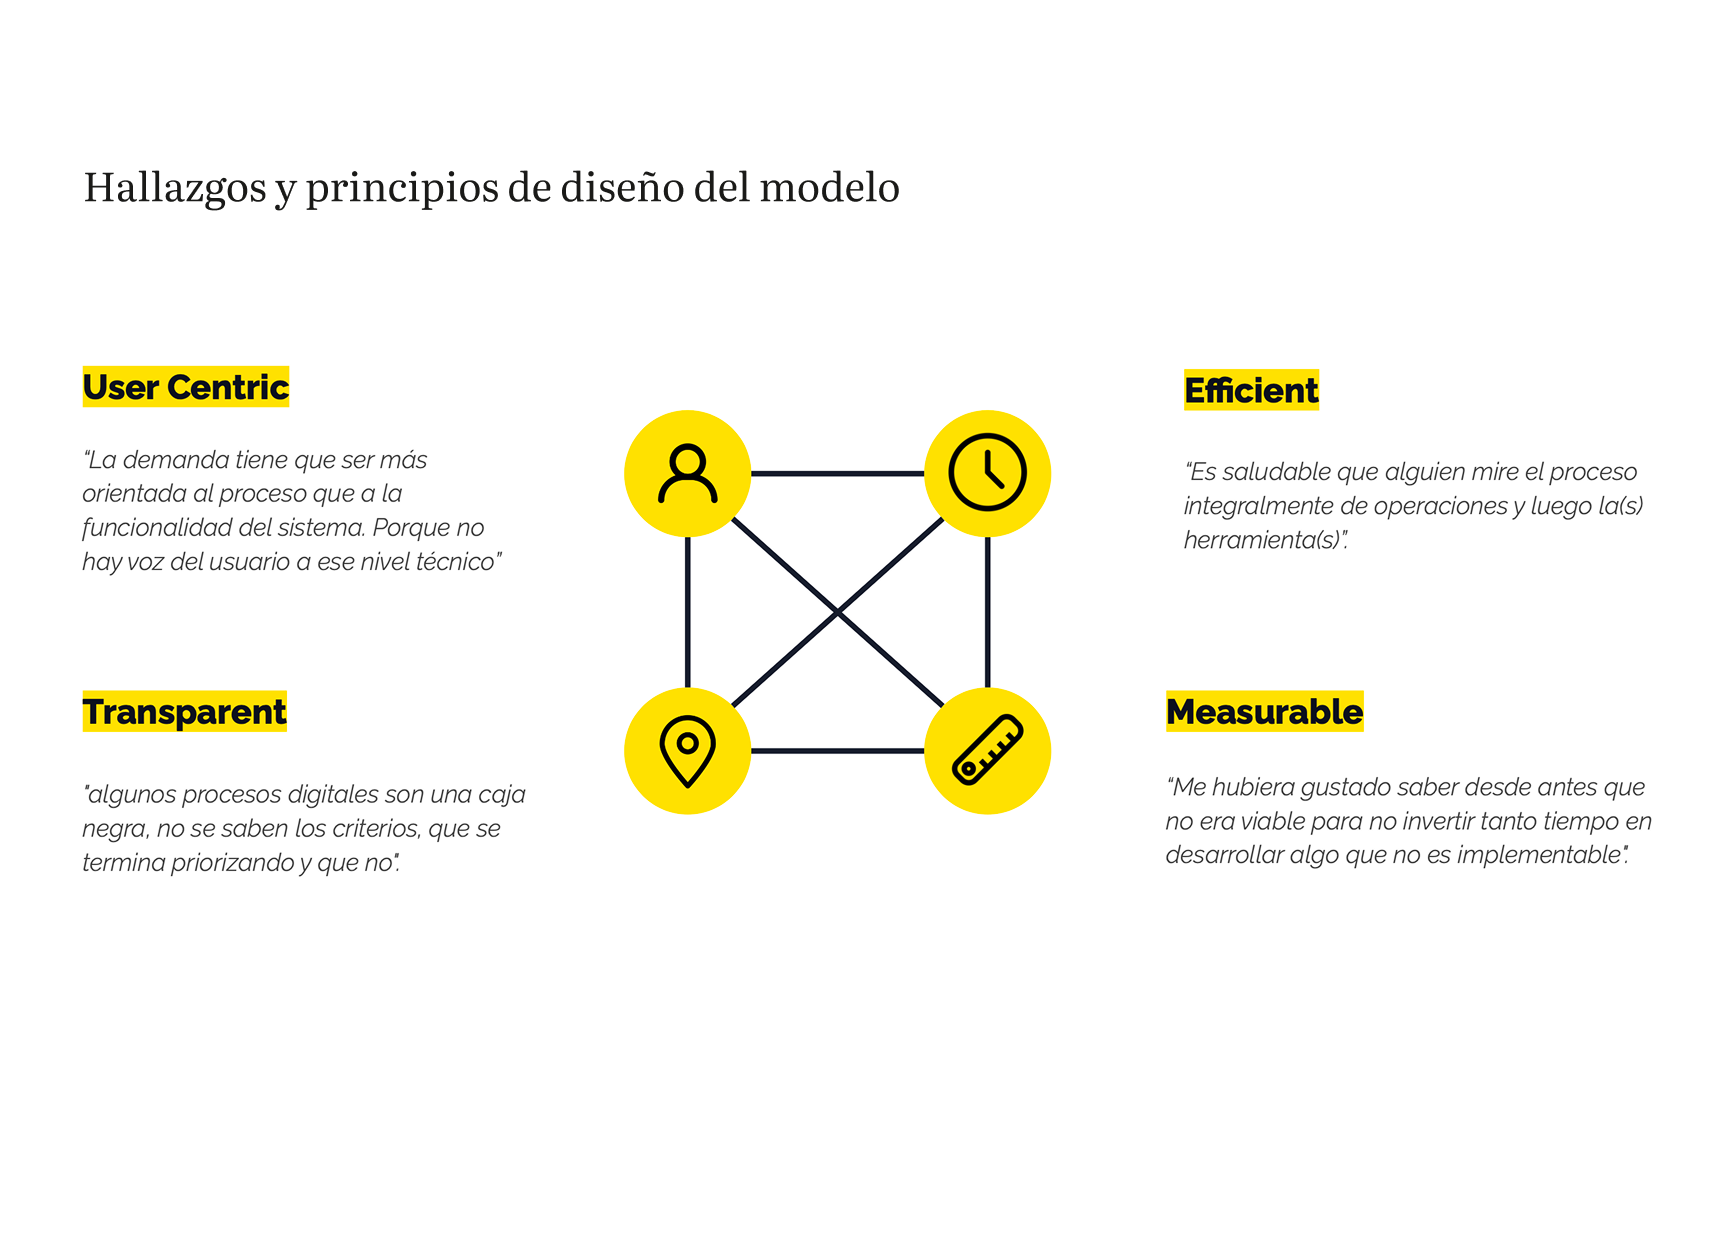
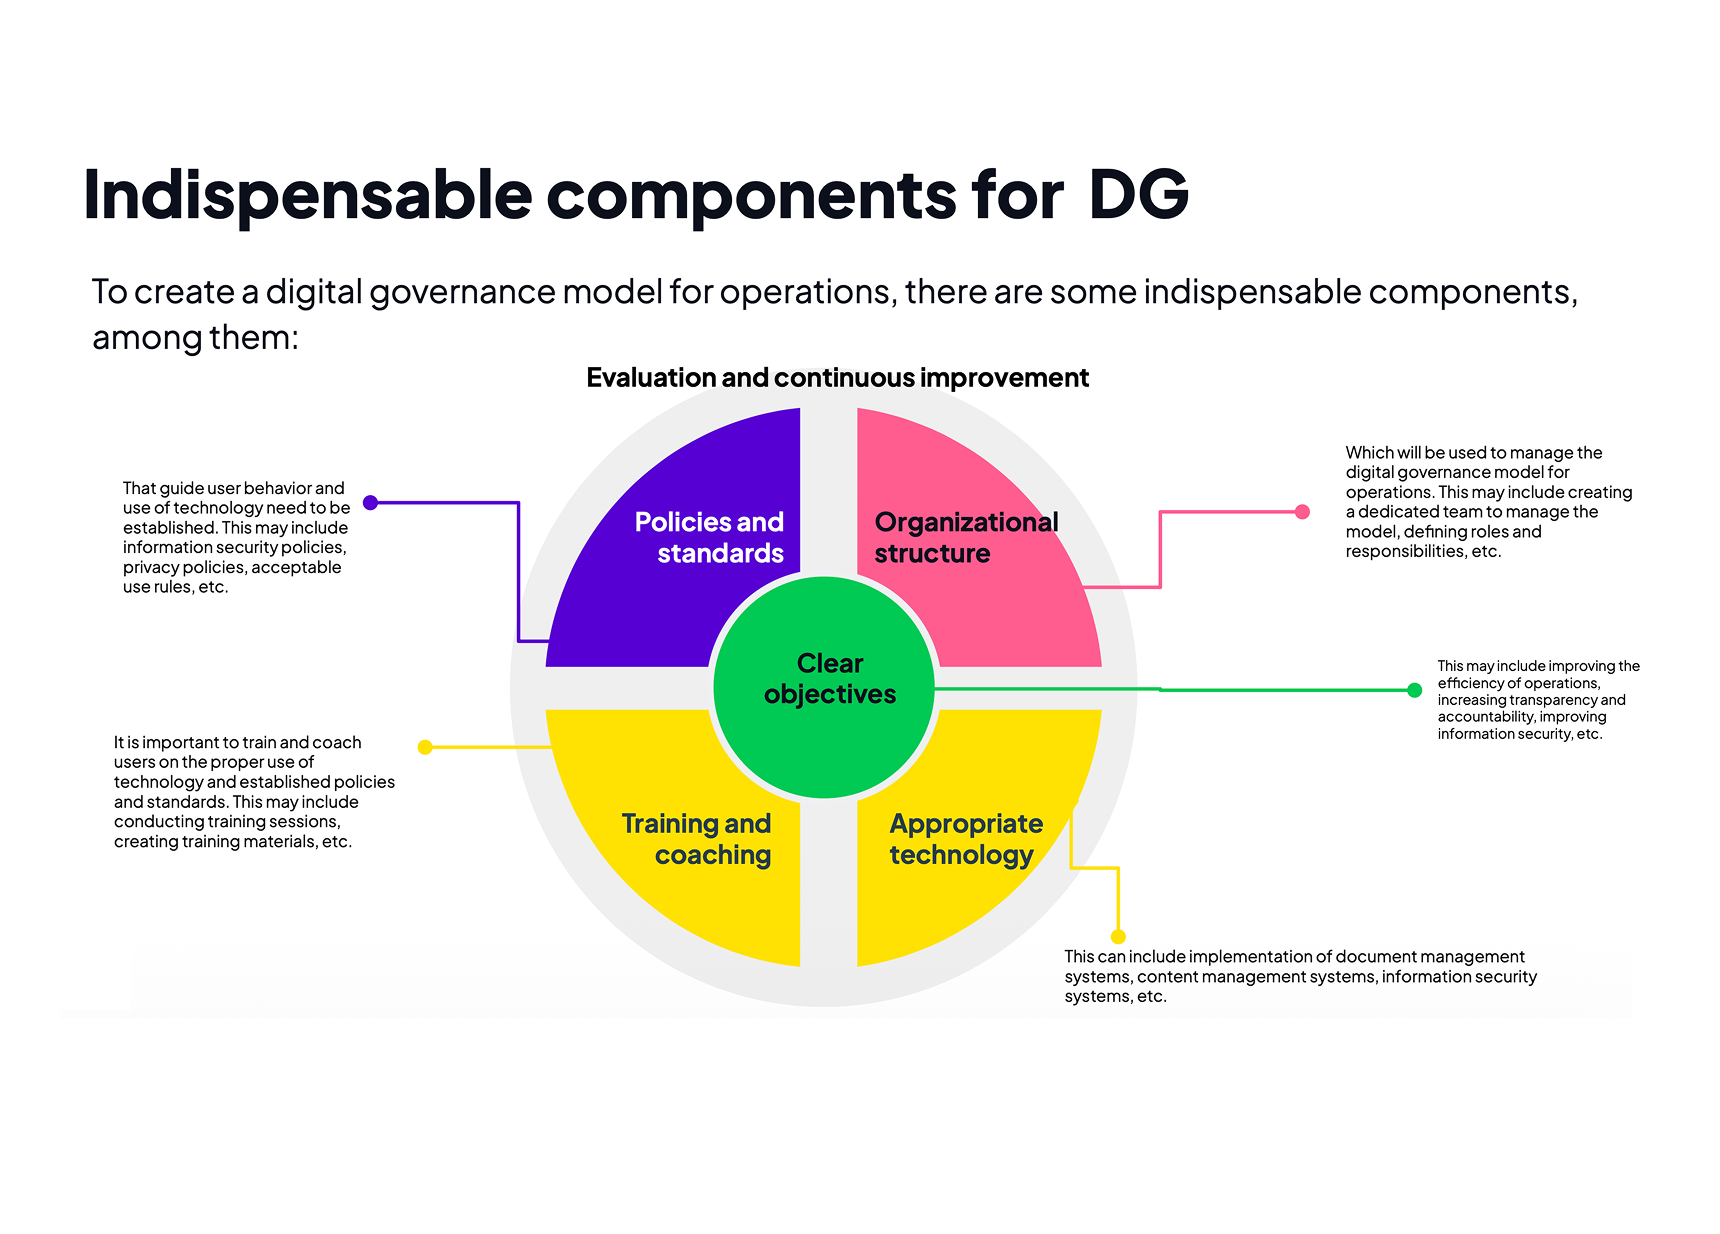
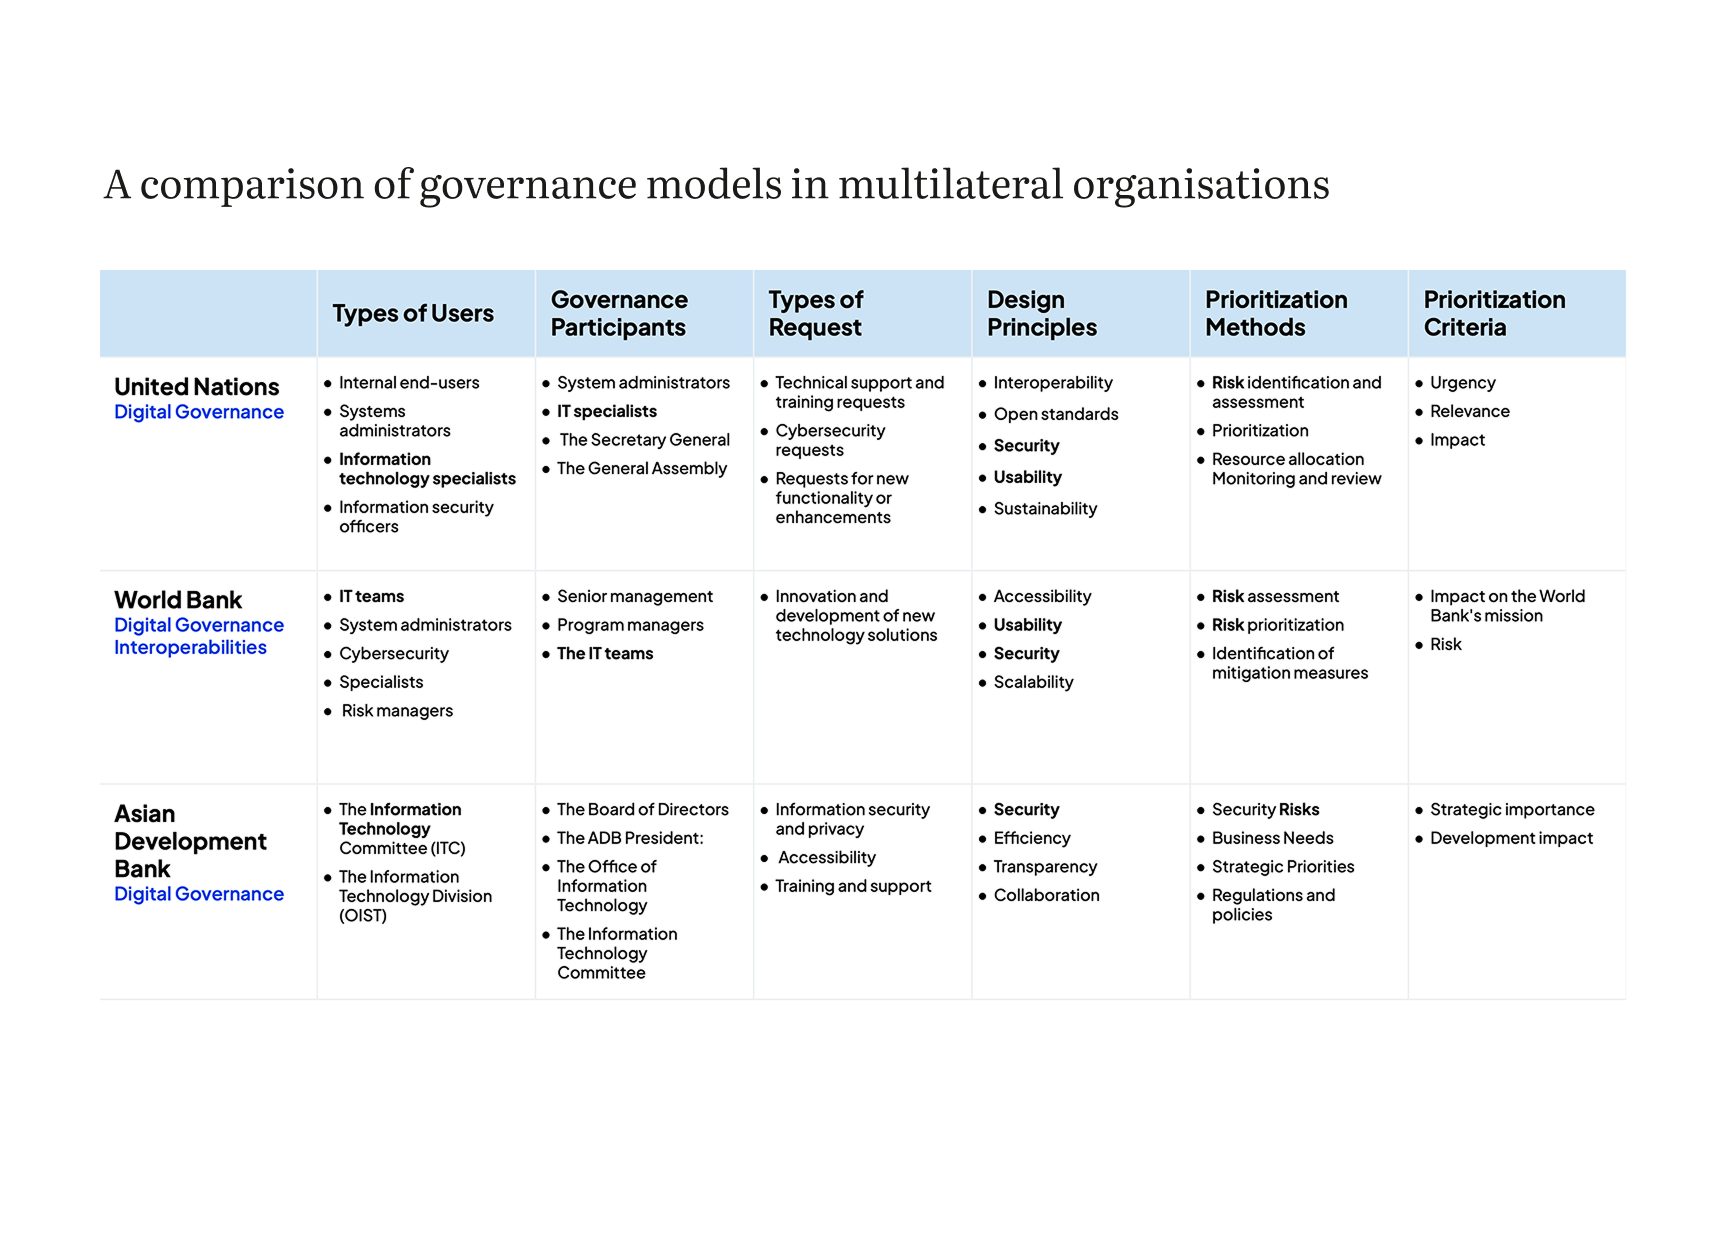
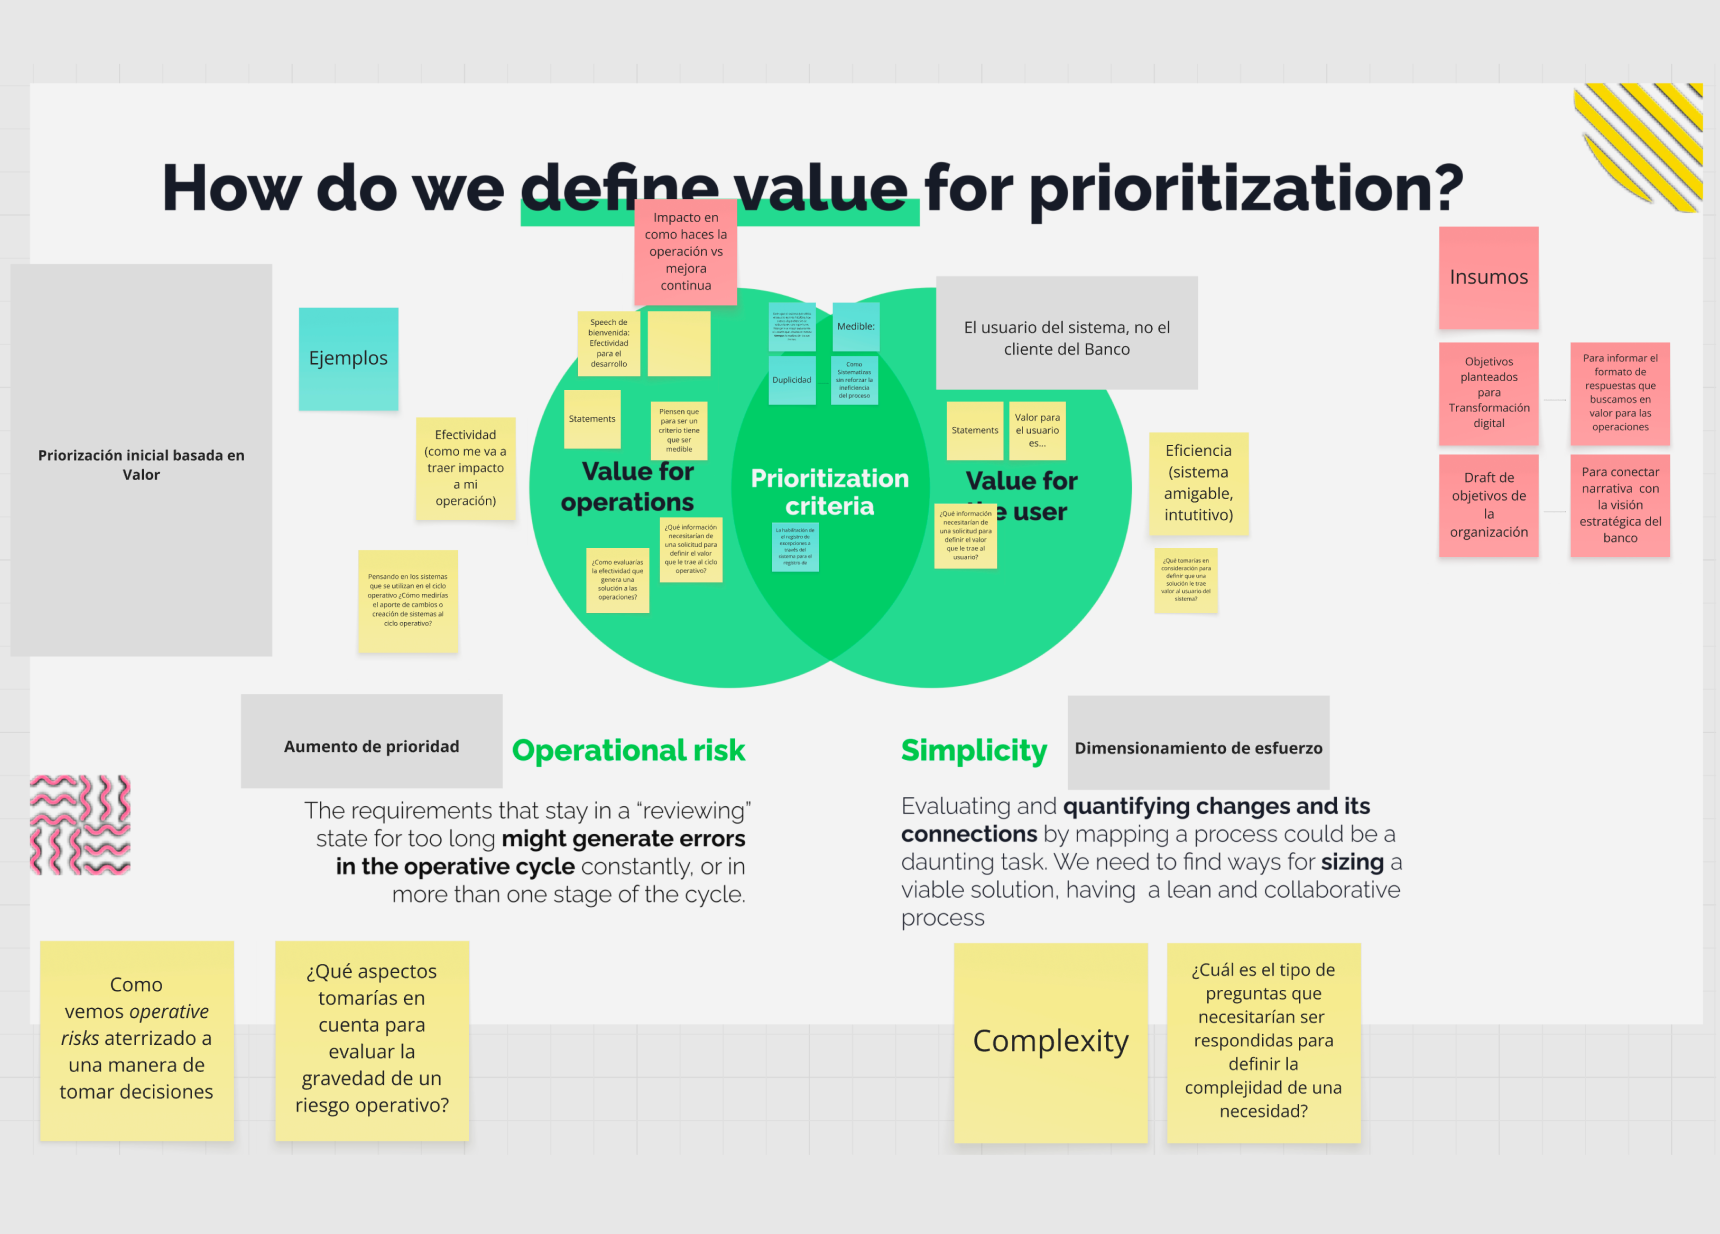
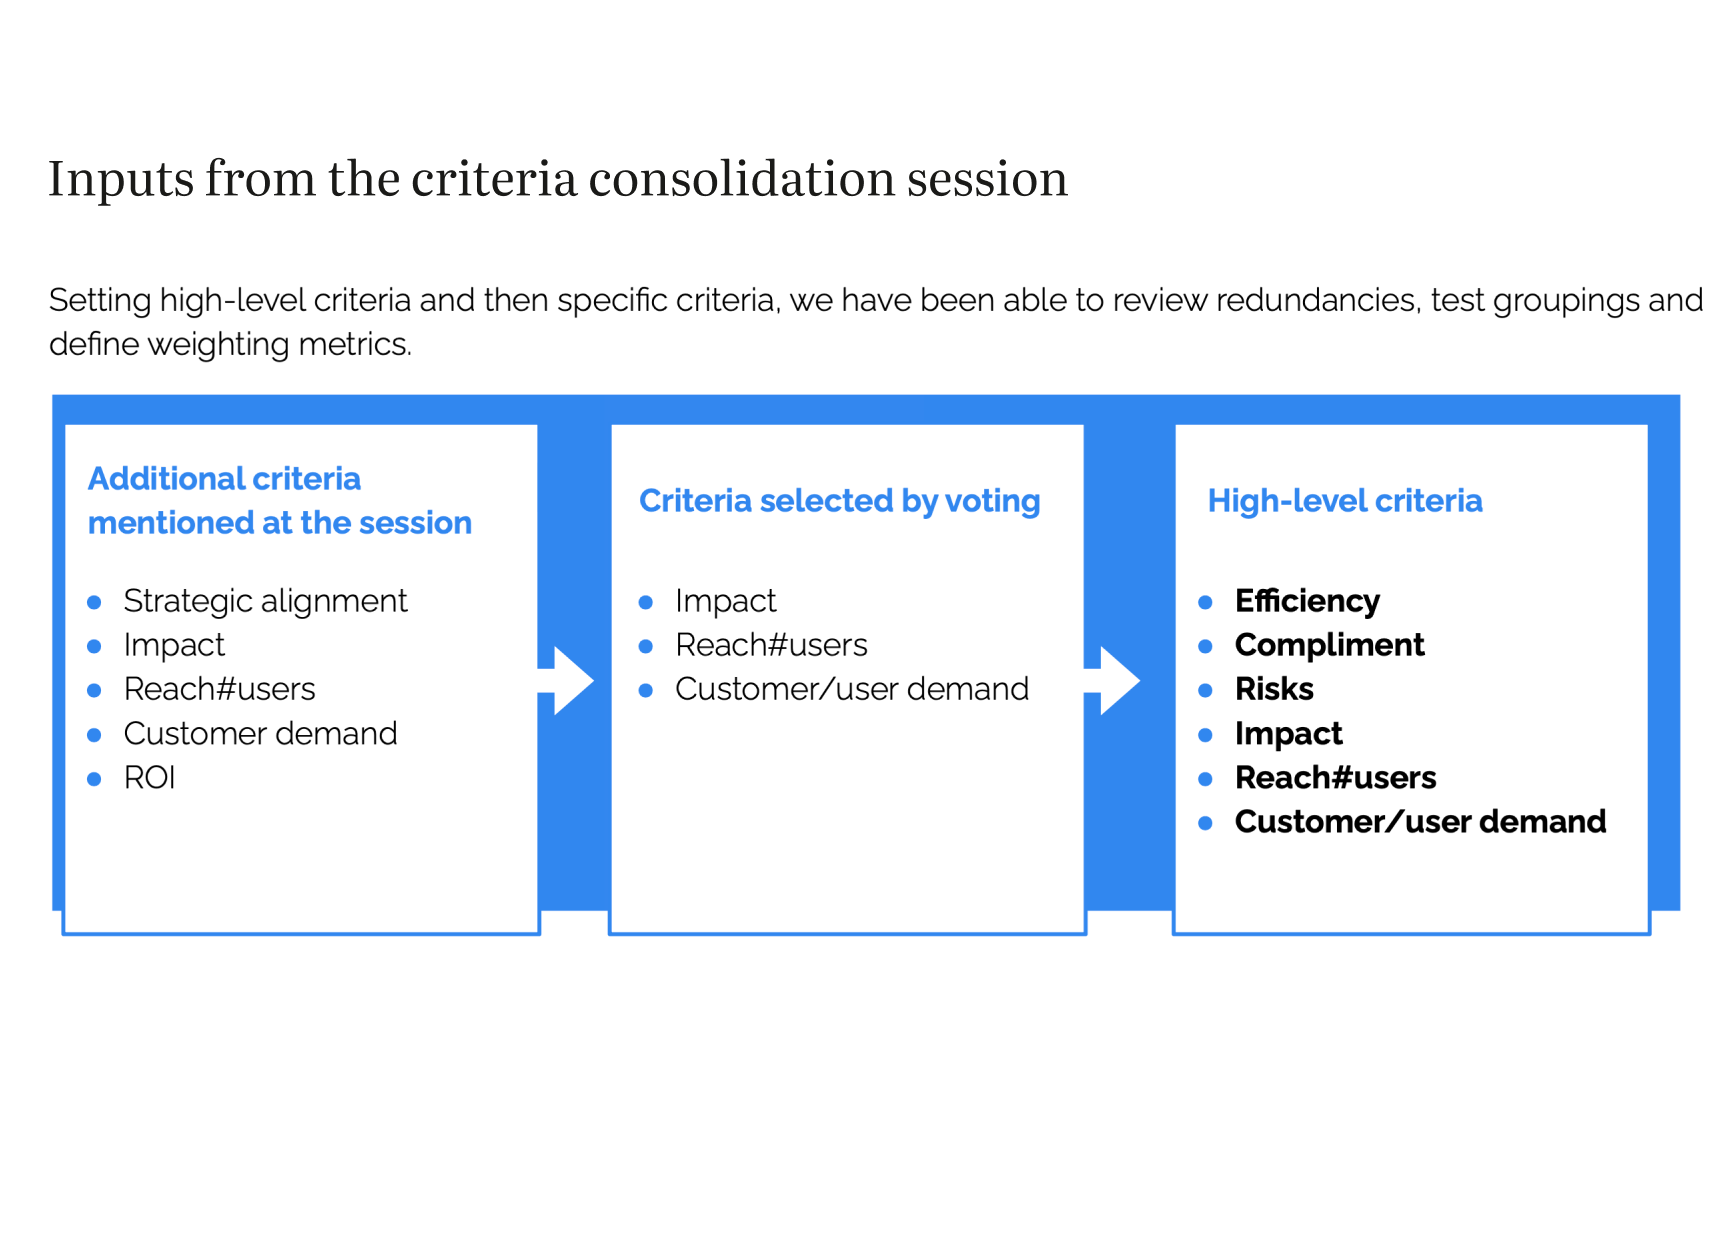
Paralelamente, hicimos benchmark de modelos de gobernanza digital en otras organizaciones multilaterales y analizamos frameworks globales de priorización de iniciativas digitales. Sintetizamos los hallazgos en 4 clusters:
User Centric, Transparent, Efficient, Measurable. Pero el hallazgo más poderoso no cabía en ninguna categoría limpia.

1

People try to avoid bureaucracy

«What we did was bypass that committee and make it agile.»
· Interviewee, operations area

People didn’t avoid the process out of indiscipline — they avoided it because it was rationally more efficient to do so. Any new model ran the risk of becoming another bureaucracy to bypass. The design could not ignore this dynamic.

Decisions for a changing environment

1

Design for uncertainty, not for the current state

We had two options: design the model for the existing organizational structure (simpler, faster) or design it modularly so it would survive the restructuring ITE wanted to implement. As a team we chose the second. This meant designing multiple implementation scenarios adapted to different organizational configurations.

  • Un modelo que no quedaría obsoleto antes de implementarse.
  • Mayor complejidad de entrega y más fricción en la co-creación.
2

Asynchronous first, synchronous instance only for divergences

The evidence was clear: the bank was expert at creating committees with too many people that ended up paralyzing decisions. We designed the model so that prioritization occurred asynchronously via an automatable objective formula, and the synchronous instance was only convened when there was divergence between stakeholders.

  • Diseñar un proceso mas ligero por sobre una mecánica rígida
  • La tensión: varios stakeholders querían mayor representación en las decisiones. Defendimos la decisión con los datos de las propias entrevistas.
3

Well-defined roles even if they generate friction

The model required new roles: a Request Management Team, a Model Owner, a lean decision instance. We could leave them abstract to provide flexibility, or define them precisely even if that meant questioning whether the bank could fill them. We chose the second: well-specified roles with clear responsibilities.

  • Roles validados por diferentes actores y departamentos involucrados para distintos escenarios
  • Requirió un esfuerzo adicional para convocar, iterar y validar cada ajuste

From research to the Playbook

  1. Fase 1

    Qualitative research

    To define the scope of principles, processes and stakeholders included in the governance model, we conducted a qualitative research phase with 26 members from 9 IDB areas, performing different functions in operations, technology and organizational change units.

    Deliverable → Research report + thematic clusters

    Clusterización

    Bajda y análisis de entrevistas

    Clusterización

    Bajda y análisis de entrevistas

    Principios del Modelo

    Research output

  2. Fase 2

    Benchmark

    Compilation of governance models from other multilateral organizations + global prioritization frameworks.

    Deliverable → Benchmark Report

    Componentes generales

    Comparativa de Modelos

  3. Fase 3

    Operational context mapping

    Mapping of the bank’s digital operational cycle (sovereign-guaranteed loans), cataloging all systems used in the process, their active or obsolete status, level of technical debt and support required, to understand what needs could fit into the model.

    Deliverable → Digital operational cycle map

    Scroll

    Ops Digital Cycle Map

  4. Fase 4

    Co-creation with stakeholders

    3 workshops with 12 key IDB actors, which allowed us to iterate and obtain the key components of the model:

    • User archetypes of the model (Navigator, Creator, Business Rules Owner),
    • Categories of requests accepted by the model,
    • Prioritization criteria,
    • Decision process.

    Deliverable → Validated model components

    Value definition

    Usuarios del modelo

    Criterios de priorizacion

    Categorías de solicitud

  5. Fase 5

    Proof of concept

    We conducted a moderated validation session on the request intake form prototype, with 5 users responsible for operational cycle systems. The session confirmed the navigability of the flow and identified 3 ambiguity points resolved before final delivery.

    Deliverable → User test report

    Artefacto para ingreso de solicitud

  6. Fase 6

    Model design

    User Journey Map of the 6-stage process, definition of actors and interactions, prioritization formula, decision instance, communication milestones.

    Deliverable → Flow diagrams and blueprints

    Alineamiento estratégico

    Ingreso de requerimiento al sistema

    Priorización sistémica

    Medida del esfuerzo

    Sesion asíncrona

    Recomendaciones para la ejecición

What the design delivered

El modelo resultante tiene 6 etapas: alineación estratégica y propuesta de solución, ingreso de la solicitud, priorización sistematizada mediante fórmula objetiva, sizing del esfuerzo, aprobación del backlog y recomendaciones para ejecución.

Cada etapa tiene actores definidos, herramientas específicas, indicadores de seguimiento y puntos de comunicación hacia los solicitantes.

Lo más difícil de resolver fue la priorización: diseñar una fórmula que balanceara valor para el usuario, valor para el ciclo operacional, riesgo operativo, riesgo reputacional, complejidad técnica y respaldo institucional, y que fuera lo suficientemente objetiva para reducir el sesgo político, pero lo suficientemente flexible para adaptarse a contextos cambiantes. El modelo también incluye un componente de Change Management con recomendaciones para la adopción gradual, reconociendo que el cambio cultural es tan crítico como el diseño del proceso.

1

What was delivered

The final package included a 150+ page Playbook with a detailed model description and implementation guide, an executive deck for various audiences, a glossary of terms defined within the model’s context, and the design artifacts (User Journey Maps, blueprints, flow diagrams, prototypes) produced throughout the process.

View complete component index

Research

  • Key Findings Report (4 clusters: User-Centric, Transparent, Efficient, Measurable)
  • Workshop Reports (×3): Users, Categories, Criteria
  • Concept Testing Report
  • Benchmark Report (Governance models + Prioritization frameworks)
  • Ops Digital Cycle Map (Sovereign-guaranteed loans)


Model

  • Actors & Interactions
  • Strategic Alignment Checklist
  • Solution Proposal Canvas
  • Request Categories
  • Request Management Team & Capacity Baseline
  • Prioritization Formula + Applied Example
  • Synchronous Decision-Making Instance
  • Backlog Format
  • Communication Milestones + Diagram
  • User Journey Map (To-be) for the 6-stage process
  • Change Management Recommendations
  • Key Performance Indicators (KPIs) & Success Metrics


Communication

  • Full Playbook
  • Glossary
  • Executive Deck

Impact achieved

El modelo fue presentado a la directiva de Operaciones, IT y Change Management del BID y validado con feedback positivo tanto por el resultado como por la flexibilidad y el proceso de co-creación.Indicadores cualitativos de impacto:

1

Institutional alignment around 4 design principles

The bank adopted the principles User Centric, Transparent, Efficient and Measurable throughout the process, using them as a decision criterion beyond the project.

2

Implementation conditioned on hiring specific profiles

Leadership accepted that the model could not be activated without the roles we defined (Request Management Team, Model Owner, lean decision instance). A signal that the design was taken as a real roadmap, not an archived deliverable.

3

26 people from 9 areas involved in research and co-creation

That breadth generated cross-functional alignment that no single deliverable could have achieved: business, technology and operations teams arrived at the final presentation with shared vocabulary and criteria.

4

Common language between areas that didn't talk to each other

The 4 principles and the model’s archetypes (Navigator, Creator, Business Rules Owner) remained as shared vocabulary between business and technology — a cultural asset that outlives the process itself.

What I learned

Today I would redesign the co-creation sessions with the bank in terms of format, number and autonomy. Those involving profiles representing their areas before the board required facilitation that exceeded a small team’s capacity. I would bring in an organizational governance specialist from the start — not to replace the design perspective, but to carry the structural decisions that our position didn’t legitimize. This project taught me that service design in complex organizations requires a coalition of profiles, not a single quality deliverable.


Next case study

From a legacy BMS to a B2B SaaS: design decisions in a project that never reached production

Read case study →